My stockbroker and I are working on a retirement plan. Unfortunately, it’s his!
Introduction
What's the difference between an investor and a speculator? Well an investor is just someone who got their speculation wrong! I suspect that there's more than a grain of truth to this joke and I've certainly fallen into the trap of turning a short-term position into a long-term one in the past; all in the name of experience though and don't tell my wife!
Ironically she even bought me The Intelligent Investor by Benjamin Graham for Christmas one year and I still haven't managed to finish it. It's a demanding read and with almost 90,000 books listed on Amazon under Accounting and Finance I'm spoilt for choice. In fact Amazon is where I stumbled across The Investor's Guide to Understanding Accounts and this is a far easier proposition.
However this accessibility shouldn't be mistaken for superficiality. The author, Robert Leach, aims to cover both the calculation and interpretation of key business metrics that are relevant to investors. In doing this he focuses on ten primary questions that anyone should ask of a company, before becoming a shareholder, and then rounds out the book by suggesting a few ways in which accounts can be (quite legally) manipulated.
All in all I find the book to be refreshingly straightforward in cutting through the thicket of company accounts; it's easy to become overwhelmed by the winding narrative of larger enterprises but with Leach covering my back I feel a whole lot more confident understanding how to ask, and answer, accounting questions.
Rather than review each of the ten questions in turn (you're better off buying the book for this) I've decided to highlight some of the vital formulae that Leach recommends. The main point to remember is that accounts are subjective and a matter of opinion; numbers are not absolute and that's why you need a few metrics in your investing tool-box in order to form your own opinion of a company.
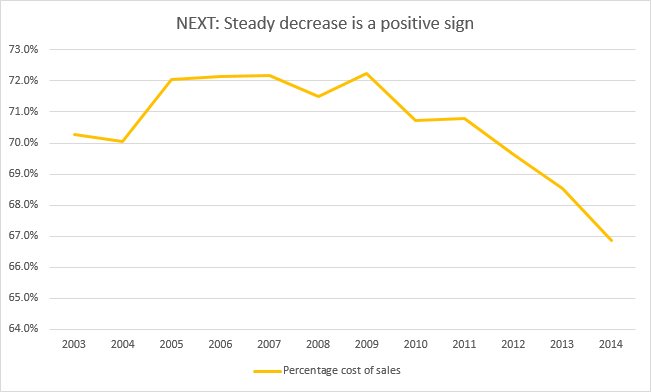
Percentage Cost of Sales = Cost of sales ÷ Turnover
The first three questions in the book revolve around the fact that all companies need to sell something in order to prosper and that trade in something should be amenable to common-sense. It may involve different divisions, in distant geographies and with diverse sales patterns (to muddy the water) but these splits should make sense to the layman.
The key here is that running a company is not rocket science and if you can't get to grips with the central business model then that's a warning flag. Beyond this a company may choose to stick to its area of speciality (which implies organic growth) or it may inflate itself through acquisitions and disposals. The latter route isn't necessarily a problem but if there is a history of over-payment or of discontinuing operations then this could suggest caution.
The logic for caring about these primary questions is that businesses ultimately only survive if they can sell something for more than the total cost of achieving that sale. Hence the lower the percentage cost of sales figure is then the better chance a company has of rewarding its shareholders (and this applies whether you're looking at the absolute value or a trend).
When it comes to operating costs there is a conventional split between the direct cost of sales and the indirect overheads that support the firm as whole. The actual division can be open to interpretation but both sets of costs need to be controlled for there to be a reported profit. Since the headline profit figure is all important to the market this is where you will see adjustments deployed to maximise these leading items.
Some examples of adjustments include exceptional items (that shouldn't occur every year), discontinued operations, depreciation and capitalisation (costs being charged in a different period) and deferred tax (normal rate not being paid). Simply put there are numerous ways to manipulate the profit numbers and a good accountant should always be able to suggest a trick or two.
Current ratio = Current assets ÷ Current liabilities
Working capital is all about how business capital can be trapped in accounts receivable (e.g. bills yet to be paid by customers) and the need for there to be a balance with current liabilities (e.g. bills that need to be settled in the next year). On the whole current assets and liabilities need exist in harmony with perhaps 50% more in the way of assets to offset the risk of some credit not being collectable or available.
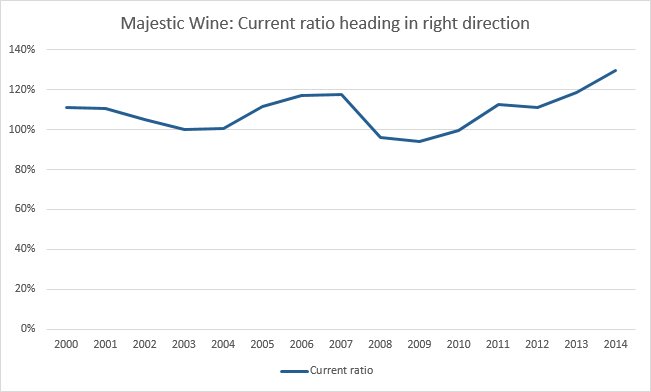
However, as Leach points out, an appropriate current ratio is sector specific (like so many metrics). Supermarkets can trade quite securely with a low ratio because they harvest cash from customers while keeping their suppliers on extended credit terms; at the other extreme construction companies can work on contracts for many years before being paid in full (and often customer disputes derail the expected income).
ROCE = Profit before interest and tax × 100 ÷ Net capital employed
When doing a spot of fundamental analysis the holy grail of metrics is one that's both easy to calculate, from the evidence that all public companies provide, and directly applicable across firms in all sectors. Say hello to Return on Capital Employed. In essence this measure takes the total return generated and compares it to the total amount of capital required to get this return. Even more simply it's a measure of how much capital needs to be tied up in the business for it to generate the divulged profits.
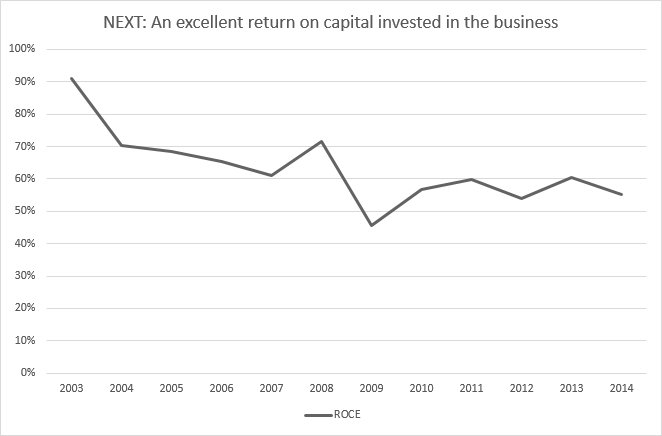
As this cash has to come from somewhere (be it shareholders, retained earnings or debt markets) then there's a cost associated with this financing. If a company is only able to generate a return that marginally exceeds this cost then it's likely that the ROCE will be low. This is always bad. The higher the ROCE is the better and in general this is indicative of a company that is quite asset-light and yet still nicely profitable. The only downside is that firms like this are usually somewhat expensive as everyone wants a piece of the action!
Debtor period = (Trade debtors × 365) ÷ Sales
When reading a financial report it's absolutely paramount that you dig into one section, more than any other, and that's the cash flow statement. The reason for this is that generation and consumption of cash isn't a matter of opinion but simple record keeping; so as close as you can get to straight facts. More than this cash is the life-blood of any business; run out of cash and you run out of road. If these numbers are manipulated then you're looking at fraud rather than a bending of the rules.
As an investor its important to know where the cash comes from, how its being spent and whether the amount of cash being generated is in line with the reported profits. Ideally 100% of operating profits convert into operating cash flow; if the reported profit is substantially greater than the cash flow then you need to determine what's artificially boosting the profit. Often this comes down to creditors and debtors since these can be fudged to benefit cash flow in a single year (i.e. working capital changes) but overall there should be ongoing consistency in the level of conversion.
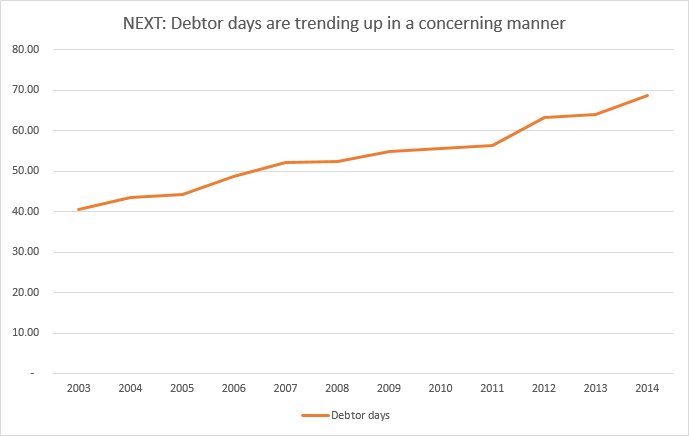
A typical example of synthetically boosting profits is a company that reports great sales but doesn't actually get round to billing for them and gathering the cash. So debtors build up on the balance sheet and the longer they stay there then the less likely it is that these debts will be collected; instead they'll probably just get written-off. So to keep tabs on this the debtor period should be calculated for a number of years; this allows you to both judge the absolute value and detect any worrying trend.
Gearing = (Total borrowings - Cash) ÷ Shareholders' funds
The other side of the coin is debt. There's nothing wrong with debt per se; companies borrow all of the time when they believe that they can generate a decent return, or they're in a loss-making phase prior to break-even or they aren't generating enough cash organically to sustain the business. The first of these is fine, the second is ok in the short-term and the third is a recipe for disaster.
The problem with debt is that you're reliant on your lenders and all they care about is whether you've got enough headroom to cover interest payments and that you have assets to back up the debt. Ultimately debt is what kills shareholders (rather than companies) as creditors always come first. So as investors we need to think like a lender and this leads us into learning about interest cover, credit ratings and gearing.
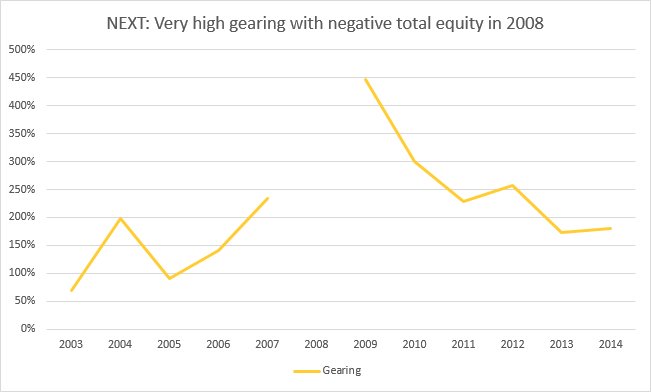
The last of these, gearing, is of interest because it relates to leverage and the tension between equity and debt. If a company has very little debt then all of its earnings are due to this invested capital; but if the company borrows this same capital again (100% leverage) then it can boost its earnings and yet retain just the same number of shares. So the earnings per share value looks great and all of the managers take hefty bonuses.
The only problem is if trading takes a turn for the worse then the banks still take their pound of flesh and shareholders get peanuts; this is operational gearing in action. Along with the absolute debt value it's also worth keeping an eye on current and long-term liabilities as these pertain to the debt repayment profile and any urgency that might result. Nothing makes a company quite as vulnerable as having to scrape together cash to meet a coming repayment milestone.
Dividend cover = Earnings per share ÷ Dividend per share
One of the main reasons to own a part-share in a business is to benefit from the free cash-flow that it generates. Any mature, profitable company should create more cash than it consumes and practically all of this should go to shareholders; usually via regular dividends (paid twice a year or quarterly). A good indicator of management being aligned with owners is for there to be a stated dividend policy that's backed up by the actual record of disbursements.
However the downside of such a record, and the reliability that it implies, is that executives can become wedded to the idea that the dividend can never be cut. The result is a company like Lloyds Bank which paid an unchanging dividend for five years, raised it once and then blew up in the financial crisis. There have been no further dividends for six years now (and counting)!
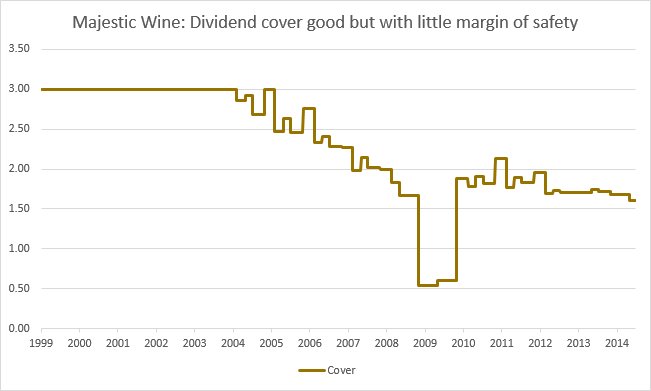
This event was, to a degree, presaged by the lack of dividend cover that Lloyds exhibited. For many years the cover was scanty, much less than 1.5, and dividend cover is a key metric that indicates how much headroom there is from earnings to pay out the surplus. If the earnings aren't there then they can't be given to shareholders (which means that being able to calculate a reliable, consistent EPS is important as a measuring stick for income).
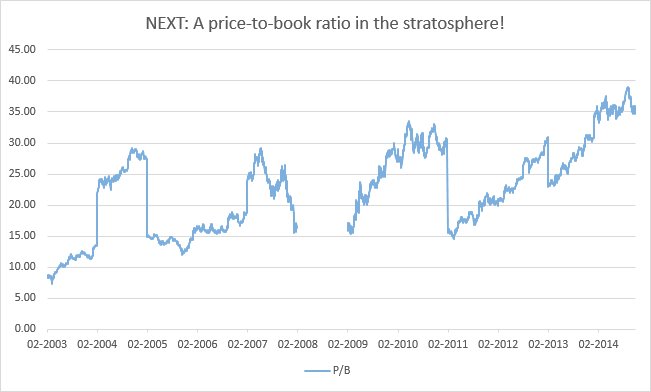
Price to book = Share price ÷ Shareholders' funds per share
If you're a value (or crisis) investor then you'll probably care how much the stock market thinks a company is worth and whether this value is anywhere near the total asset (book) value. Essentially this is because such assets are the ultimate backstop when a company falls into liquidation; in a fire-sale you hope the cash raised will outweigh all liabilities. Certainly this has been the case in the past with cash-shells although they are something of a special situation.
The reason that they're special is that the market is giving them a value less than the cash they have in the bank! This isn't quite as illogical as it sounds; many such companies simply burn through their cash by throwing it at the next big idea and soon there's nothing left. However if enough shareholders can get together and force the company to close down and return this cash then they can do very well. Still it's an odd situation and most companies trade above their book value and in some cases, like NEXT, very much above it!
The wrinkle with assets is that they, primarily, come in two different forms: tangible and intangible. The former are obvious, real things like buildings, vehicles and office chairs. In general they are purchased so that the business can continue to trade with no thought given to resale value (since most business chattels have minimal second-hand worth). In contrast intangible assets exist only as a side-effect of double-entry bookkeeping and the need to make the spreadsheet balance.
For example let's say that Company A buys Company B for £10M. It's quite likely that the assets of Company B aren't actually worth this much; they may only be worth £4M in the accounts and as such Company A can only add the amount of £4M to its own assets when the takeover is complete. The balance of £6M has to be accounted for, as the cash has been spent, and so this is logged as £6M of goodwill in Company A's accounts. Over time this will usually be amortized (planned depreciation) or impaired ( an unplanned write-off) but both of these are matters of opinion.
The strange thing is that before it was bought Company B couldn't have claimed this £6M of goodwill for itself; it only came into existence when the takeover was complete even though Company B was already worth £10M. This variation in approach can lead to significant differences in the balance sheets of companies that grow organically and those that prosper through repeated acquisitions. The latter are full of intangible assets that can be moulded in various ways to shape the reported profits.
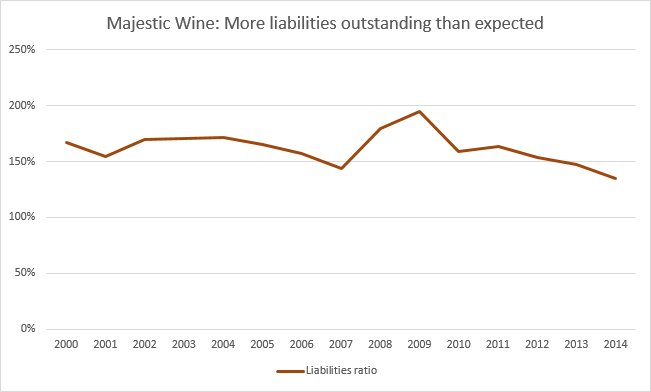
Liabilities ratio = Liabilities ÷ Costs and expenses
The final three questions that Leach asks us to ponder are somewhat more qualitative than anything that comes before. The aim here is to find reasons not to invest and so avoid the losses that pull-down portfolio performance. The first relationship to check is the liabilities ratio since this tells you whether spending is under control. A value of 20-25% is healthy since that implies that the company has 2-3 months of bills outstanding and that's generally quite reasonable. The downside of this metric is that it includes all costs and all current creditors and so is a measure of coping more than anything else.
Beyond this simple test there can be many other liabilities and one of the worst is a big defined benefit pension liability. This is a double-whammy in that the company is both exposed to open-ended funding requirements and also vulnerable to regular evaluations of the pension fund deficit. Both of these are expensive problems to fix and this is money that the shareholders might otherwise have expected to receive. Often the killer details are hidden in the notes and that's where you'll find contingent liabilities and other potential UXBs.
A different sort of risk is that the directors of a company are your employees and if they act like it's their business then you'll have problems. So you want them to have a decent stake in the business, aligning their interests with other shareholders, but not so many shares that they have control of the company in all but name. A tricky balance if you want directors that work well together, for the benefit of all stakeholders, and don't treat the company like their personal fiefdom or pay themselves inordinate salaries and/or bonuses.
Finally as shareholders in a company we typically own ordinary shares and these rank as the lowest of the low when it comes to dividing the spoils if a business folds. So it's important to be aware of other equity and debt instruments (preference shares, share warrants etc) that can act to dilute your interest in the company. It's also sensible to be aware of other significant shareholders and whether there is any pattern or significance to these holdings.Usually the largest holdings are institutional but family-run firms can have large residual interests and occasionally individuals build up a large position in a target company.
How companies can massage their figures
This book isn't really about the secret plans and clever tricks of unscrupulous management; for that you need something like Accounting for Growth. But in even the most strait-laced of accounting guides you can't really avoid mentioning the ways in which the standards can be bent (to say nothing of outright fraud). So Leach covers three of the most popular tricks as a form of postscript.
Anticipating profits
This is simply the process of recognising profits before they are due and in so doing polishing today at the expense of tomorrow. While the music plays this trick can be repeated endlessly but eventually the songs come to an end - usually when new management take over and want to kitchen sink the accounts. Just look at Tesco and their recent fiasco. Case closed.
Capitalising expenditure
Another common way of bumping up profits is to capitalise some of the expenditure incurred by the business in normal operations; perhaps some of the cash spent on research and development. This has the dual effect of stripping that expenditure out of the profit and loss (leaving just a rump of depreciation) while also bumping up the fixed assets on the balance sheet. Great! This approach is reasonable enough if the costs do have legitimate value, like long-term R&D, but much of the time this isn't the case. Just look at WorldCom; an expensive mistake.
Off balance-sheet expenditure
This tactic veers towards the fraudulent but at its core the idea is quite simple: for reporting purposes groups of companies need to consolidate the results of all of the subsidiaries to provide a clear look-through in the accounts. This is very sensible but plenty of managers have created companies, or other entities, which aren't consolidated (legitimately or not) and these are a perfect receptacle for debts, unwise transactions and other nefarious accounting entries. The only problem is how can an investor find these unreported black-holes? If such evasion can catch out Vodafone then what chance do the rest of us have?
Conclusion
The beauty of The Investor's Guide to Understanding Accounts is that it's really quite an elementary book. Accounting, and even double-entry bookkeeping, really isn't very complicated; it's all of the odd rules, variations and exceptions that keep accountancy firms in their gleaming offices. Fortunately as investors by merely understanding the fundamentals of profit, cash and assets we'll be way ahead of most people.
So the ten tests presented here provide a very good grounding in the basics with lots of examples from real-life companies as well as mocked-up examples. These all serve to clarify the ideas in the text and demonstrate how to apply the metrics to companies of interest. Space is also left for an overview of different business types (stay away from football clubs), accounting standards and where to source reporting information from.
Overall I gained real insight from Leach's guide and it's usually pretty close by when I'm looking at companies these days. It may very well not make my fortune, since it contains no investment philosophy, but I am certain that it'll help me reduce my losses. Since I profess to be more an investor than a speculator this loss-aversion is no bad thing!
Disclaimer: I own this book and heartily recommend it to all.