Robert Walters (RWA) is one of the world's leading professional recruitment consultancies, specialising in the placement of permanent, contract and temporary positions across all levels of seniority. Established in 1985, Robert Walters recruits across the accounting, finance, banking, IT, human resources, legal, sales and marketing, supply chain, procurement, engineering and support fields. With offices in 30 countries our truly global network enables us to meet the demands of clients and candidates whose needs extend beyond local markets, whilst our strong local foundations provide us with unique insights into local industry and culture.
Introduction
OK enough of the marketing BS. Generally my aim is to identify high-quality, cash-generative companies that are priced reasonably. This might seem like an overcrowded trade but even the best companies can fall back when there are concerns about cyclical markets, future growth potential and economic conditions. To find these shares I run a number of filters over the whole UK market and a while back recruiter Robert Walters popped up. After some thought I invested and saw the share price both continue upwards and plunge downward as sentiment changed; given that the price is currently at a low point I thought that I should revisit the company to see whether the investment case still stands up.
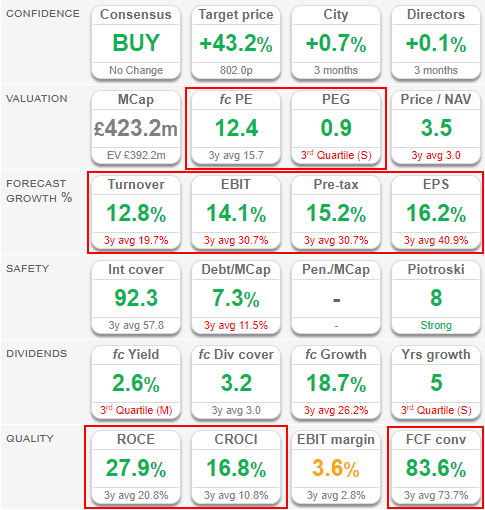
Looking at the SharePad summary I very much like to see an all-green set of values. More specifically ROCE of 27.9% and CROCI of 16.8% are both high values which are continuing to improve (compared to the 3-yr average). Driving this change, in part, has been sales/profit growth and both of these are set for double-digit growth according to forecasts. This compares favourably with a P/E of ~12, where this is down from recent highs, although growth has slackened compared to the 3-year average. In my mind then RWA passes the quality/value test at the high-level.

The summary from Stockopedia backs this up with a very high QualityRank of 99, largely driven by ROCE and a high Piotroski F-Score, with the ValueRank coming in at 56. This is a little lower than I'd expect with the culprits being a middling yield, of 2.5%, and high P/B and P/FCF metrics. Still the MomentumRank is higher than seems reasonable, given a 33% drop in price from its 52-week high, but this fall is entirely offset by good earnings upgrade momentum and a good level of earnings surprises. So a solid set of scores and any company with a StockRank of 92 is worth further investigation.
![]()
Notably RWA has generally had a high StockRank, apart from a low period in 2016, and these times coincided with the share price more or less doubling. Since share price momentum is a component of the rank these measures are not independent and I don't see the StockRank as particularly predictive; instead I see the rank as a way to tilt my portfolio towards "better" shares and RWA could be one of these.
Stock-specific Analysis
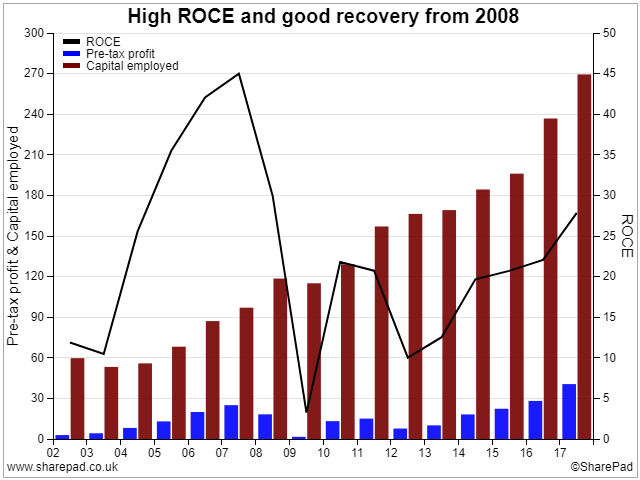
Looking back over an economic cycle a few things stand out for RWA. The first is that the company is understandably tied to economic conditions; when a down-turn comes then hiring dries up and profits fall precipitously. On the other hand when the economy is doing well then profits surge and the ROCE improves dramatically (currently at ~20% lease-adjusted). What I find interesting is that the ROCE rise since 2009 has taken place despite the amount of capital employed almost doubling. This suggests to me that the incremental return on new capital is high and that management are good allocators of capital:
Thinking about the drivers of this ROCE performance the key improvement has been a 50% increase in capital turnover over the last decade to >4.5x (beating the earlier high point of 3.8x) with turnover quadrupling. In contrast the EBIT margin hasn't done a lot but at least the margin is trending in the right direction with some improvement in recent years.
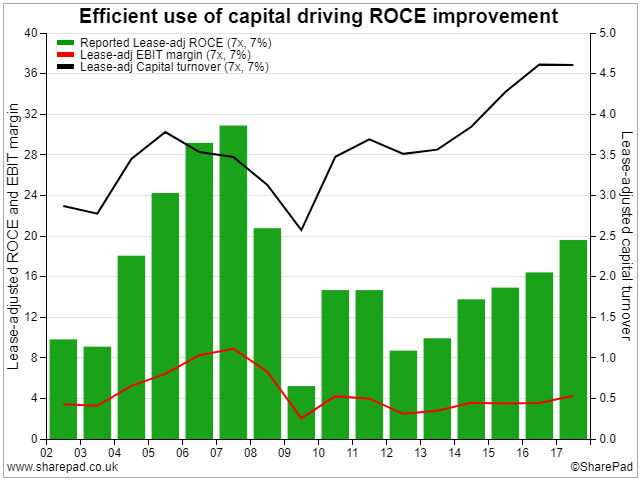
I do wonder though whether there's scope for EBIT margins to get back to the 8% level last seen in 2006-07? Only a few years earlier, in 2003-04, profit margins were comparable to the current situation and so I can see some room for optimism if the global economy stays stable.
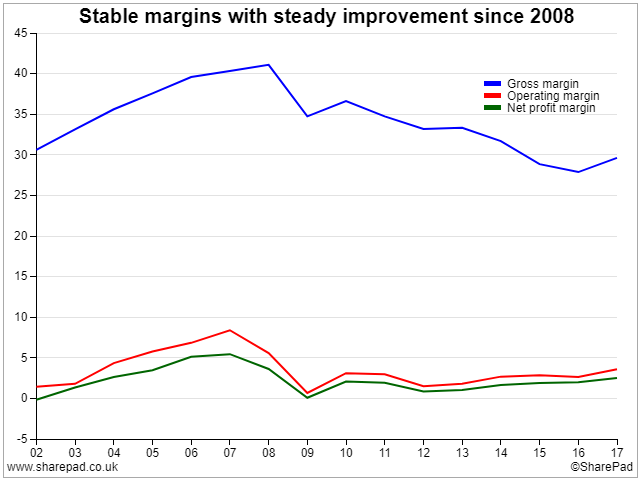
On this front I've spent some time digging into the key market segments (Asia Pacific, UK, Europe) as I believe that the differing performance in these areas can be very revealing. At the gross margin level most regions have maintained their margin level over the last 15 years, except for the UK with sustained downwards pressure, but the operating margin history is more revealing:
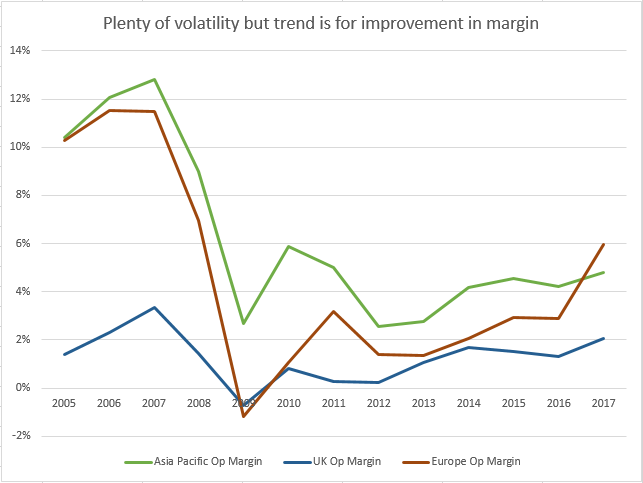
It's clear that Asia-Pacific has always enjoyed a higher operating margin than any other region and that the margin in UK has always been low - probably as a result of intense competition in this mature market. Meanwhile Europe has generally posted a middling margin except that positive momentum over the last 5 years has pushed this to a new high. I'll be checking to see if this improvement was maintained in 2018 when the final results come out in March.
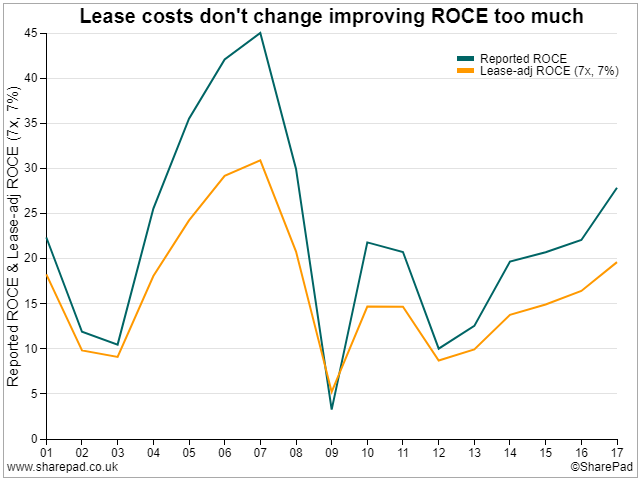
As an aside I always use the lease-adjusted ROCE in calculations since, in my mind, this is a more honest and conservative measure than just ignoring the off-balance sheet debt that leases arguably represent. In some companies, such as Next plc or The Restaurant Group, the difference between the two can be huge with the unadjusted ROCE being twice the adjusted value. At Robert Walters the gap isn't quite so startling but nevertheless the group does take on more lease debt during fat years before sharply cutting back during the lean ones:
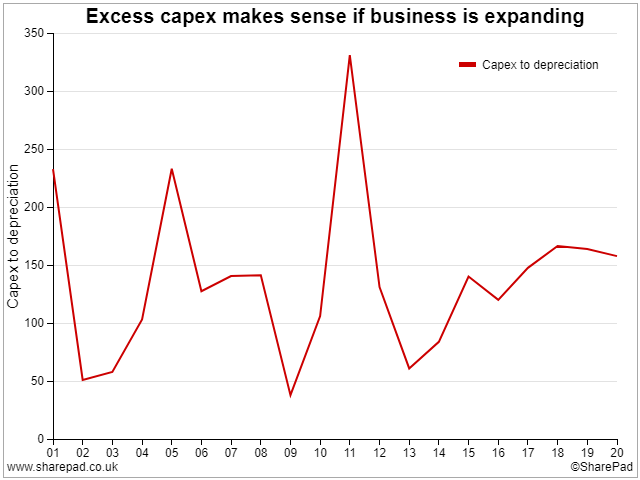
The obvious question now is to consider the capex required by Robert Walters (given the known doubling of capital invested over the last decade - see the first graph in this section) and whether it stands up to analysis. One way to look at this is to see if capex and depreciation are more or less balanced over time. If capex is persistently higher than depreciation then it's possible that profits are being boosted by over-capitalisation (of costs) or, more hopefully, that sales/earnings growth is being improved by this capital investment. In this case I think that the latter argument holds water in that the capex/depreciation ratio drops right down during economic slowdowns and then bounces back during expansionary periods:
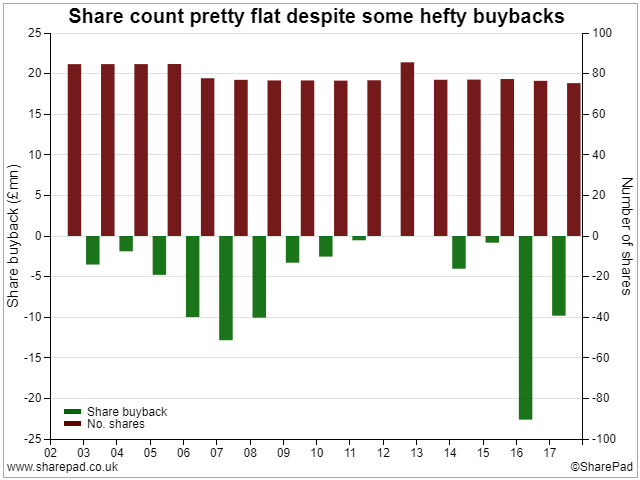
A side effect of high capital investment is that it reduces free-cash flow (FCF) and when this is combined with a fairly volatile cash conversion rate it's easy to see why the FCF conversion ratio is all over the place. That said there's plenty of cash left over to cover dividend payments or share buybacks and still keep the cash balance high and increasing:
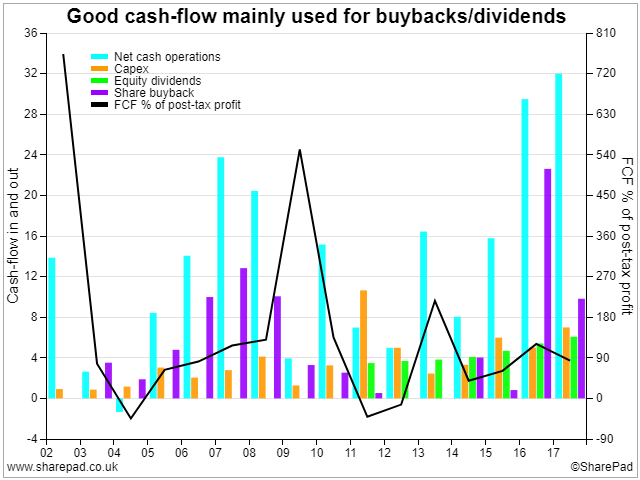
That said the share count has hardly budged over the last decade despite some very hefty purchases of shares (£37m over the last 5 years and £53m over 10 years). With the market cap being ~£400m (and maybe half of that when many of these buybacks happened) I'd have expected the share count to be reduced by at least 10-20%. Since this isn't the case my assumption is that these purchases have largely been made to offset the effect of exercised share options and thus to keep the share count roughly constant. This is not my favourite use of cash:
Talking about cash I can't help wondering, when looking at the accounts, why RWA has been paying interest since 2005 with the total interest bill hitting almost £1m last year? With cash in the bank why would the company be using any debt at all and is this a red flag? Well I've combed through the accounts back to 2005 and have found that primarily the debt revolves around receivables financing (apart from £15m of loans taken out in 2005/06 to fund share buybacks). Factoring the debtor book is pretty common in the recruitment industry (see here and here). So I have no concerns on this front and the fact that their financing facility has grown from £10m in 2009 to £45m last year indicates that sales are growing strongly. Still this factoring doesn't come cheap:
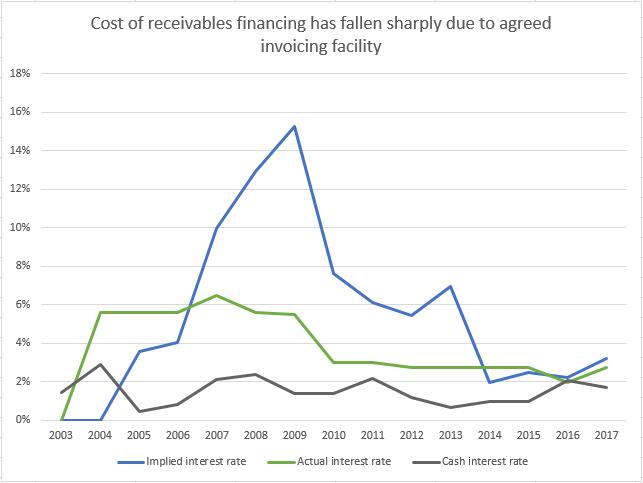
Here the implied rate is calculated by dividing the interest paid by total debt (at year-end) while the actual rate is that quoted by RWA for their loan arrangements. The key takeaway from this graph is that debt costs were very high in 2006-10 as a result of overdrafts plus the share buy-back loans (at interest rates of 5.36% and 6.94%) and that the costs of invoice financing have fallen sharply in the last few years. In fact the interest being earned on cash, in various foreign accounts, is not far off the interest being paid out!
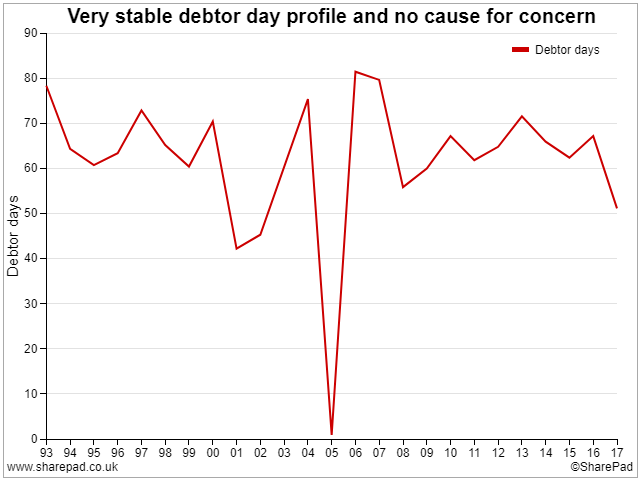
A side-effect of this financing arrangement is that RWA have real control over their debtor profile. I had noticed that outstanding trade debtors was on a rising trend and in isolation this can be a red flag since customer payment terms may be relaxing leading to a fraction of these debtors being written off (which means that profits were over-stated). In this case I'm reassured by the fact that debtor days have remained remarkably consistent over the last 25 years (at the 60-70 day level) and that the rise in debtors is simply down to more sales going through the books - with debtor volatility month-to-month being suppressed by the invoice facility:
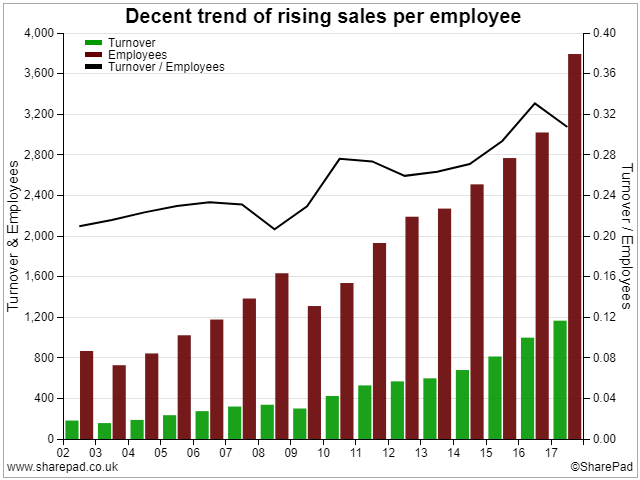
Finally given how recruitment is such a "people intensive" sector, and with sales volumes rising so dramatically (4x in the last decade), I think that it's useful to consider whether costs are under control. After all a lot of sins can be hidden when revenue growth is high. One angle on this is to examine average salary and take a view on whether the payroll is under control. Fortunately here salary inflation has been nicely controlled:
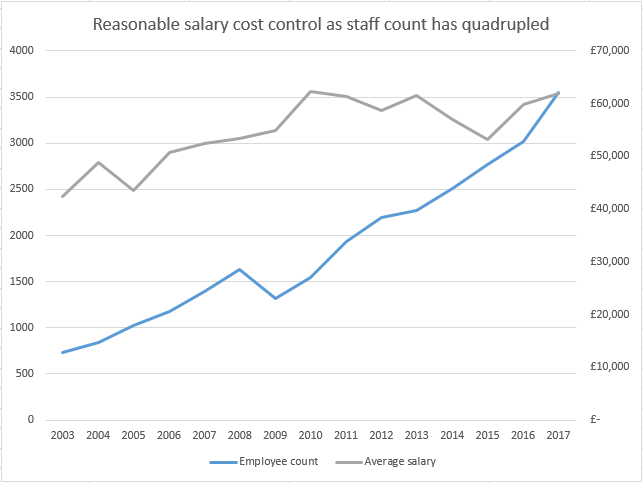
Another proxy for this question is to look at employee numbers and determine whether these staff are getting better at driving custom to RWA. What's apparent from the graph below is that the employee count has only tripled over the last period of growth and that this lags sales growth. So we have a pleasing trend where each employee brings more and more business into the company over time and adds value:
Peer-group Analysis
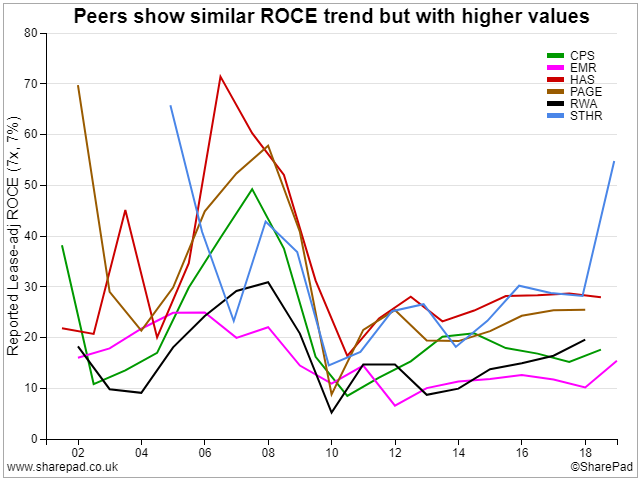
Something that I've learnt from Steve Clapham, of Behind the Balance Sheet, is the power of comparing a company to its peers. This was how he identified certain red flags with Patisserie Valerie, at Mello London, and I was very impressed by the results that he presented. So for Robert Walters I've picked a small group of peers for comparison: CPL Resources, Empresaria Group, Hays, PageGroup and SThree. Looking firstly at ROCE it's clear that this has risen and fallen in line with the other companies but that the absolute value for RWA is generally at the bottom of the group range:
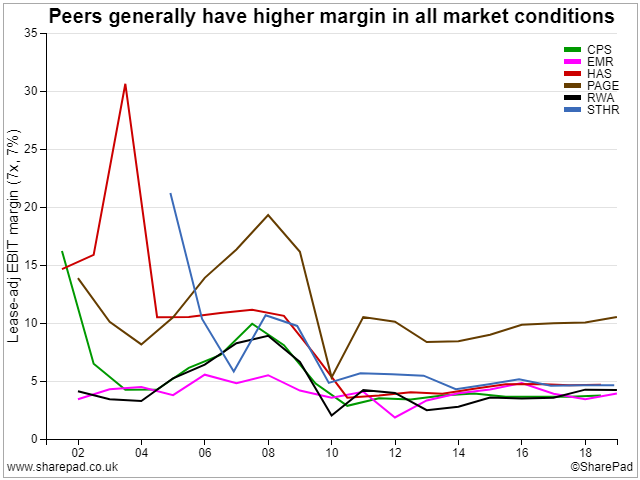
Drilling down into the components of this metric we can see that the overall EBIT margin is typically much lower than for peers (even if it's higher in Asia-Pacific and Europe) although it's fair to say that in recent years the reported margins have converged for everyone but PageGroup:
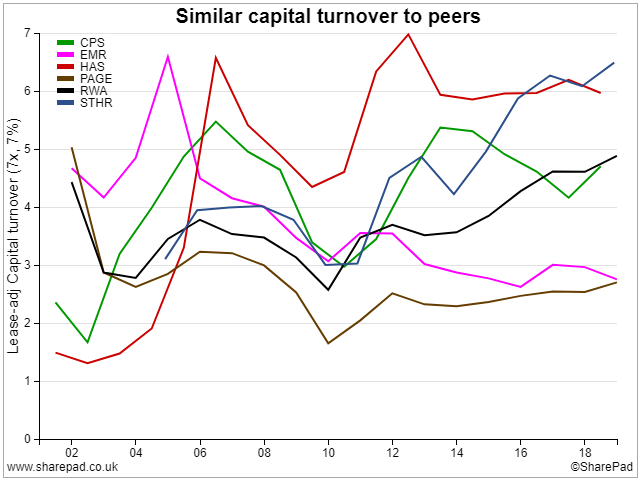
Given this convergence in margins then the difference in ROCE must come down to capital turnover and here RWA is firmly in the middle of the pack - although the best companies, STHR and HAS, have a capital turnover more than twice that of the worst companies, EMR and PAGE. Nevertheless a low margin combined with an average capital turnover are the factors which lead to the ROCE for RWA being low for the sector (even if the absolute value is quite respectable):
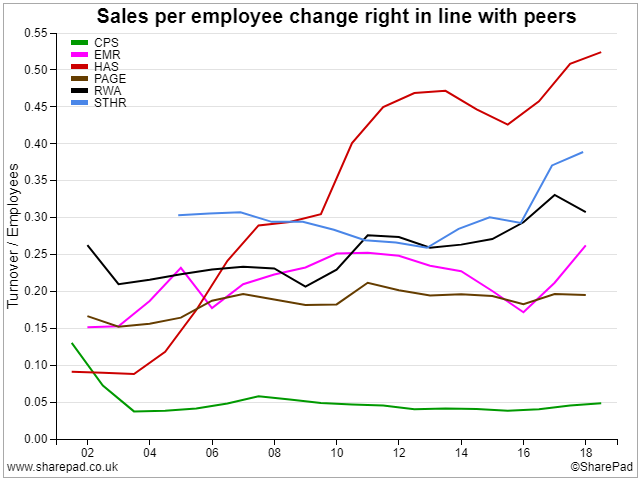
Looking elsewhere (and considering my earlier comments on cost control around the payroll) it's clear that employees in many staffing outfits are improving in their ability to generate sales. Comparatively RWA has a pretty decent sales/employee ratio and the trend here is very positive unlike some members of the peer group:
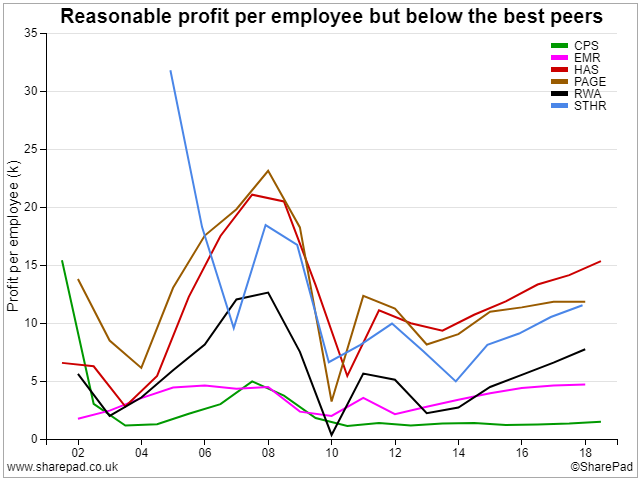
It's a similar story with profit per employee except for the fact that each RWA staff member generates a mid-range level of profit: better than 2 peers, but worse than 3, and this position has been remarkably consistent over the last 16 years. In my opinion this is simply a reflection of the fact that margins at Robert Walters just aren't as high as with other recruiters:
OK so given a satisfactory but unremarkable ranking compared to peers surely RWA is priced much more competitively than everyone else with a lower P/E and higher yield? Well actually with a P/E of ~12 it's not especially cheap although EMR and CPS are much smaller companies and so should be priced on a lower multiple. Notably RWA had the highest P/E of anyone back in 2014, at over 40, and clearly it's dropped back considerably in the last few years (although this is a common trend for everyone but EMR and that's because they've always looked dirt cheap):
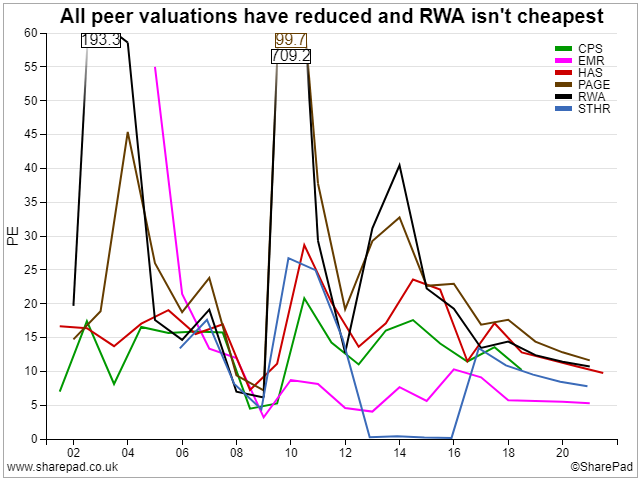
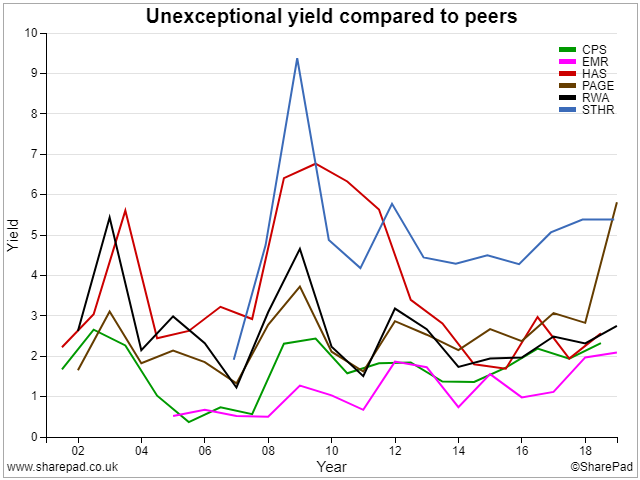
On the other hand for most of the last 20 years a P/E ratio of 12 has acted as a lower bound to the range for RWA (with 45 being the anomalous high back in late 2013) and so I'm expecting a bit of a bounce back if trading continues to improve. Sadly RWA doesn't offer an excellent yield, to keep you interested while waiting for this upturn, although it is bang in-line with its peers; I guess that recruitment, being cyclical, doesn't lend itself to producing a steady and increasing dividend payment:
Conclusion
Glancing back over all of my analysis I'm struck by the thought that Robert Walters fits the template for a good, improving, (reasonably) cheap company. The problem is that quite a few of its peers, especially Pagegroup, are just the same and this is a reflection of the whole sector being out of favour. I can certainly understand this sentiment what with Brexit, international trade wars and a winding down of central back stimulus. If any one of these catalysts tips us into recession then recruitment profits will evaporate without warning.
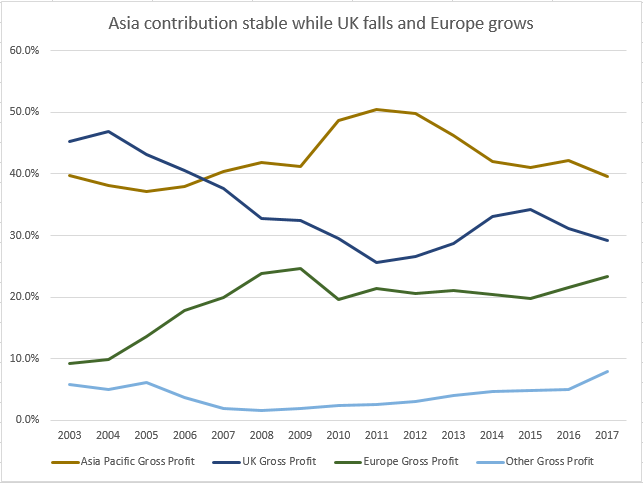
However if the global economy does remain stable then the better staffing agencies could be a decent buy at their currently suppressed valuations. Being an optimist I think that Trump will settle with China (to prepare for re-election in 2 years) and that Brexit will resolve itself in a non-catastrophic manner. Of course the latter will cause disruption in even the best-case scenario and thus I'd rather invest in a company with high and growing foreign earnings than one with a UK focus. As such I like the fact that Asia contributes the most Net Fee Income (NFI or Gross Profit) while the proportion from the UK is falling as Europe strengthens:
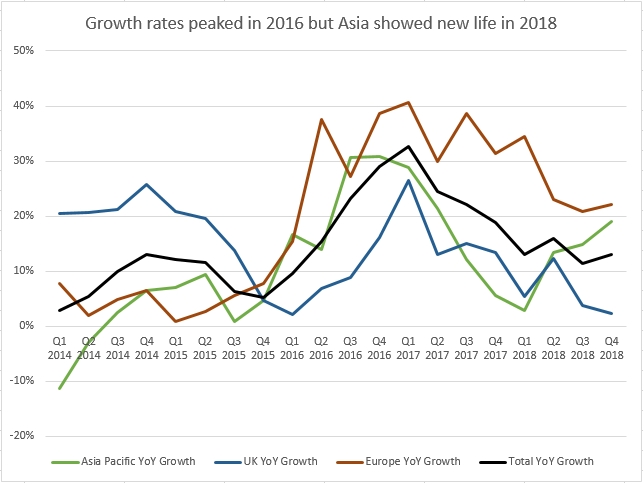
Digging deeper into the quarterly numbers, which RWA helpfully publish, I can see why the share price fell in 2015/16 before recovering strongly in 2016/18. At that time NFI growth rates in the major regions fell sharply before rebounding to reach new highs in following quarters. A similar pattern may be playing out in 2018/19 as year-on-year growth rates have moderated in all regions, while still remaining decent, with Asia then improving over the whole of 2018 while Europe grows into being the second most important region for the company. If these trends continue then 2019 could be bright for RWA:
Is that enough to make the case for investment though? There is clearly double-digit growth in the business (as seen by the quarterly updates) and foreign earnings are driving this improvement. Since margins are higher in Asia and Europe this suggests to me that profits are likely to accelerate faster than sales and this ties in with analyst estimates for 14% revenue growth and 17% EPS growth in 2018. Add in the latest trading update referring to profits being "comfortably in line with market expectations" plus cash up to £74.1m (reducing the need for invoice financing) and I can see RWA beating expectations when the accounts are finalised.
Fingers crossed!
Disclosure: the author holds shares in this company